Store Performance Monitoring Dashboard

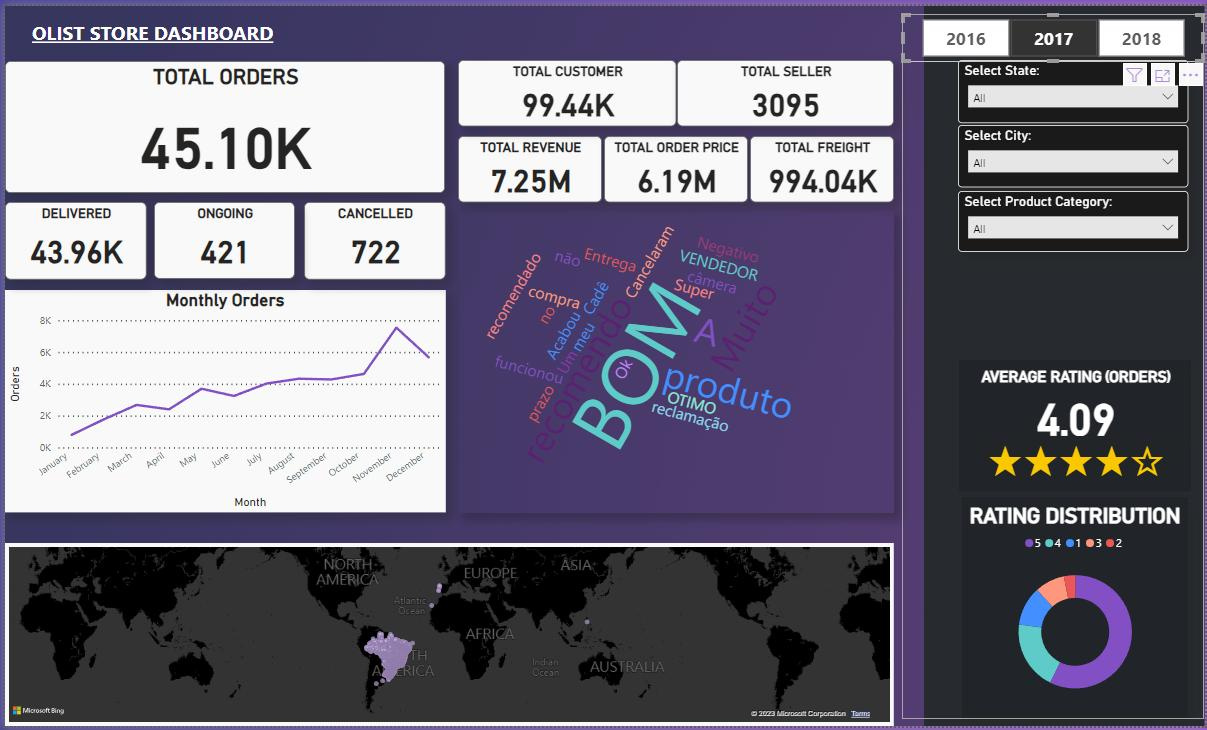
The Store Performance Monitoring Dashboard in Power BI is an interactive and dynamic tool designed to provide comprehensive insights into store operations. It enables managers to track key performance indicators (KPIs) such as sales revenue, customer traffic, inventory levels, and employee productivity in real time. With visually engaging charts and graphs, the dashboard allows for easy comparison of performance across different locations and time periods, helping to identify trends, pinpoint areas for improvement, and make data-driven decisions to enhance overall store performance.

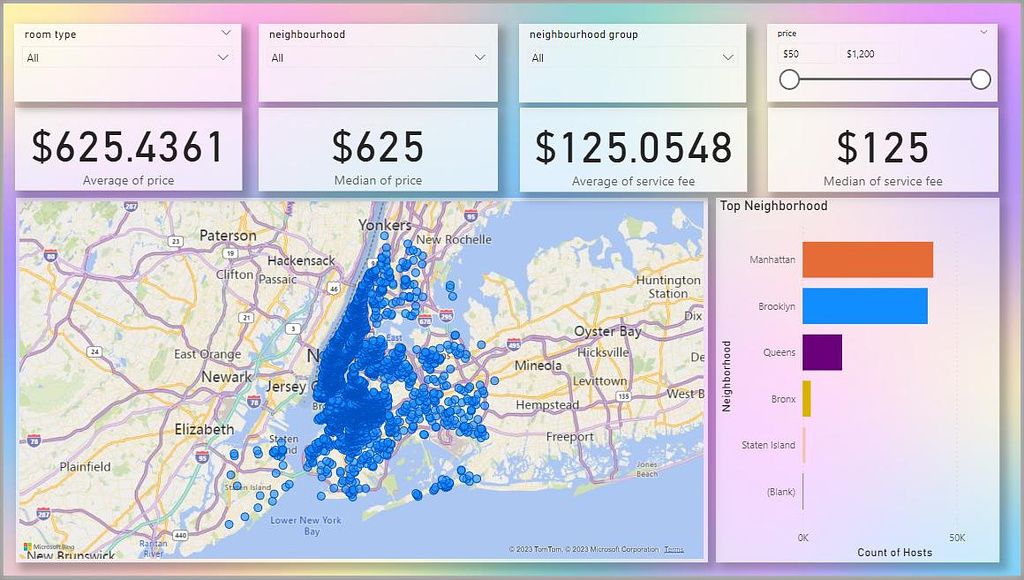
Room Rentals Dashboard

The Room Rentals Dashboard in Power BI is a user-friendly tool that provides detailed insights into rental market dynamics. It displays key metrics such as average and median rental prices, average and median service fees, and data segmented by neighborhood and neighborhood groups. The dashboard also highlights the top-performing neighborhoods, allowing users to identify prime rental areas and make informed decisions based on comprehensive market analysis.

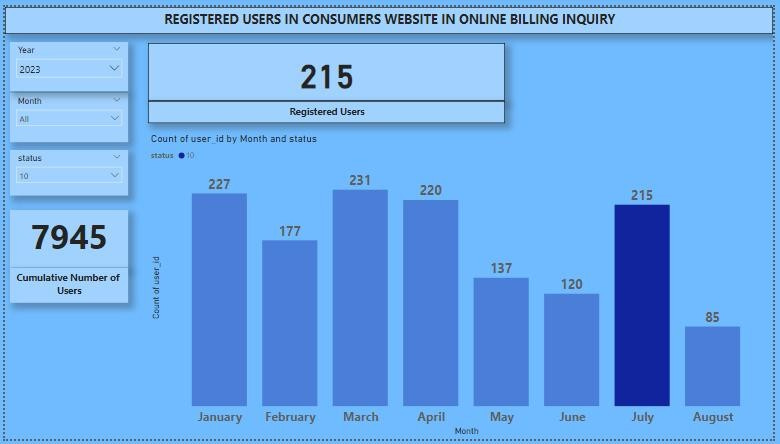
Simple Registered Users Monitoring

The Simple Registered Users Monitoring Dashboard in Power BI is an intuitive tool designed to track user registration trends. It displays the total number of registered users and breaks down registrations by month. This clear and concise visualization helps stakeholders quickly understand user growth patterns and assess the effectiveness of user acquisition strategies over time.

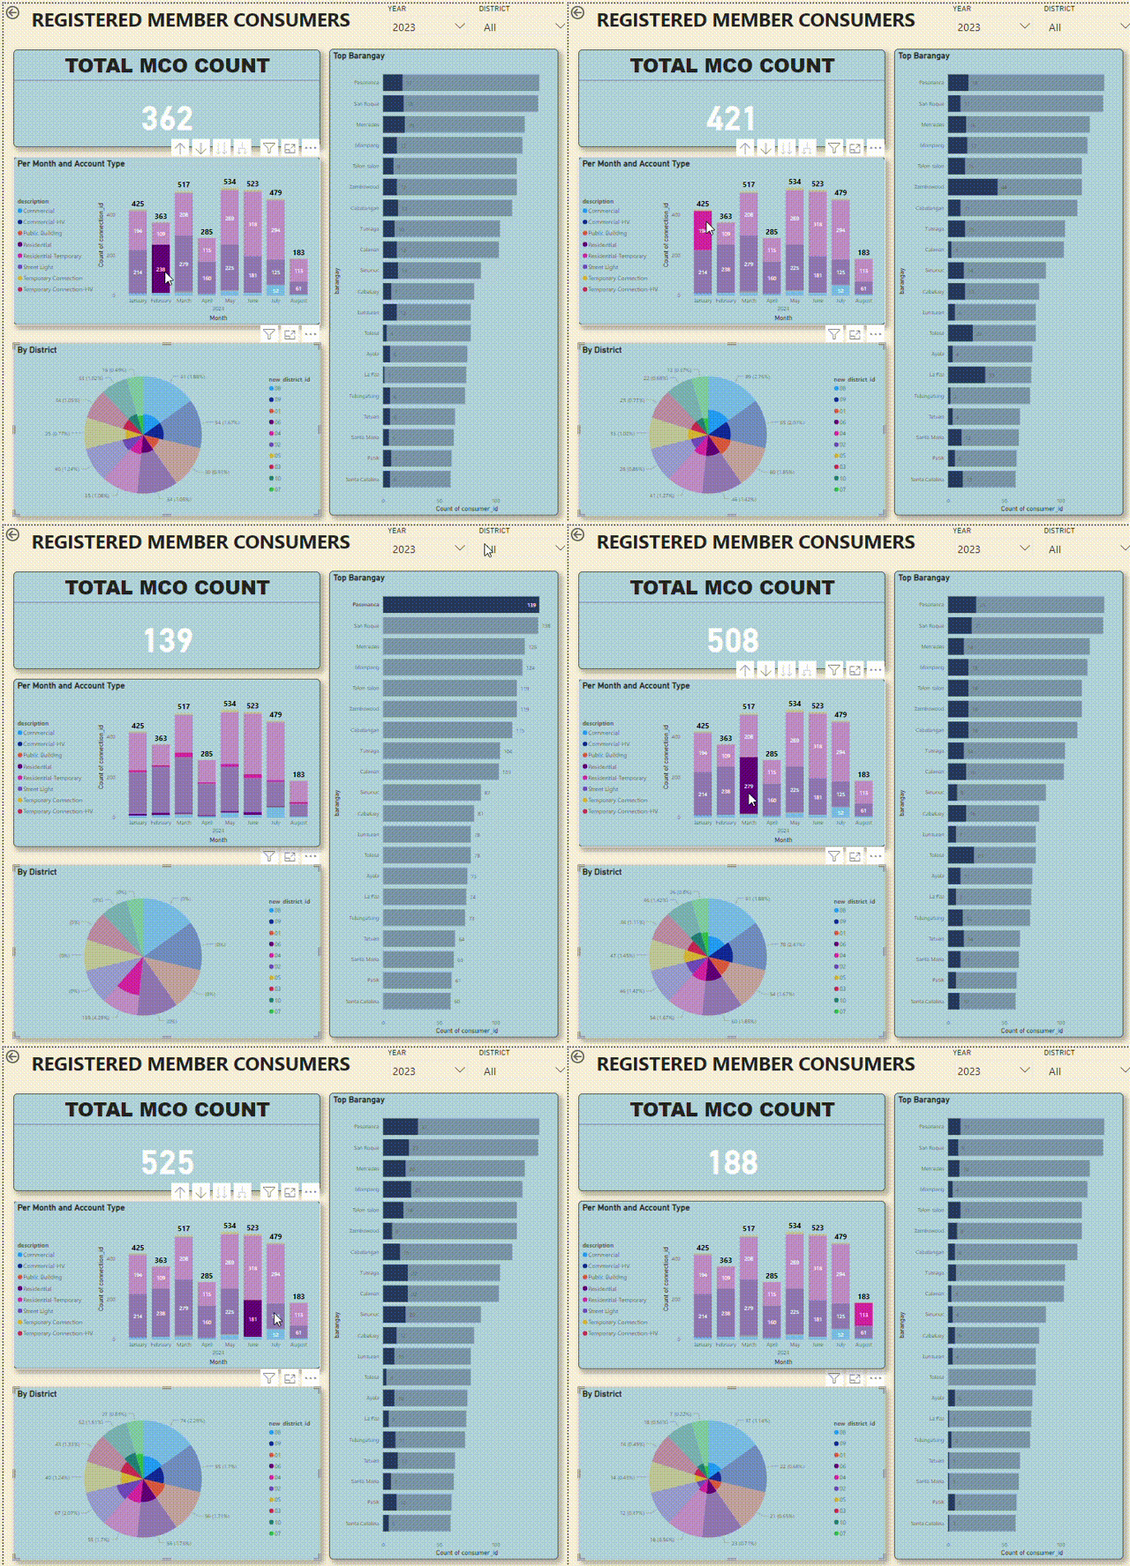
Registered Members Monitoring Dashboard

The Registered Members Monitoring Dashboard in Power BI is a comprehensive tool designed to track membership metrics. It displays the total count of Member Consumer Owners (MCO) and monthly registration trends, categorized by account type through bar charts. Additionally, it features a pie chart analysis by district and highlights the top 20 barangays. This dashboard enables stakeholders to gain insights into membership distribution and growth, facilitating strategic planning and decision-making.

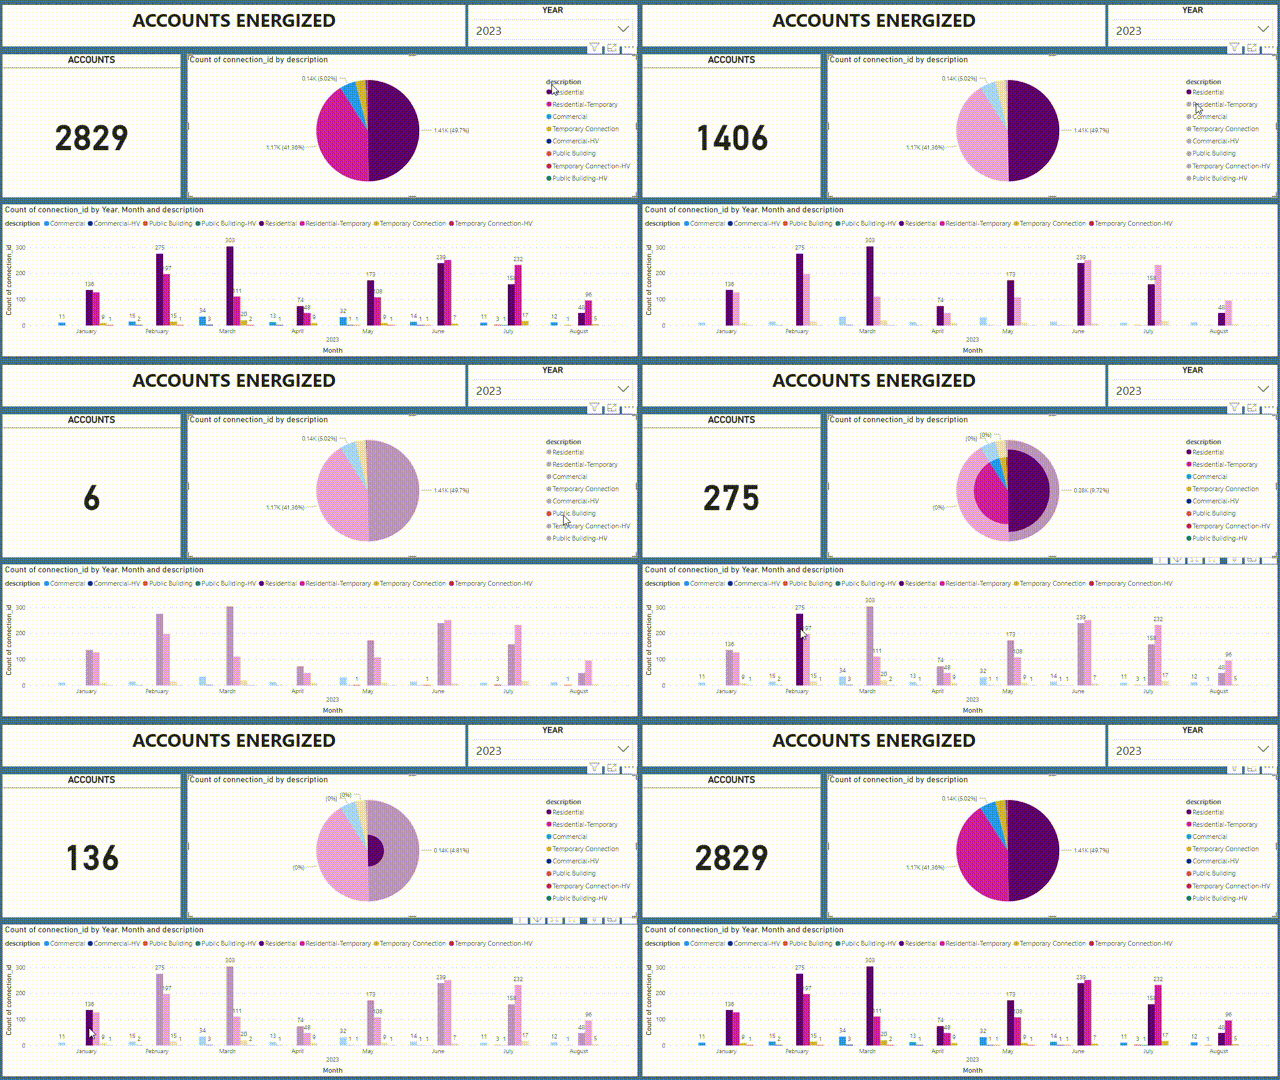
Energized Accounts Monitoring

The Energized Accounts Monitoring Dashboard in Power BI is an effective tool for tracking the status of utility connections. It displays the total number of energized accounts, categorizes connections by type with a pie chart, and shows the count of connections over time with bar charts segmented by year and month. This dashboard provides clear insights into connection trends and distribution, aiding in efficient resource management and planning.

HR Hiring Rate Dashboard

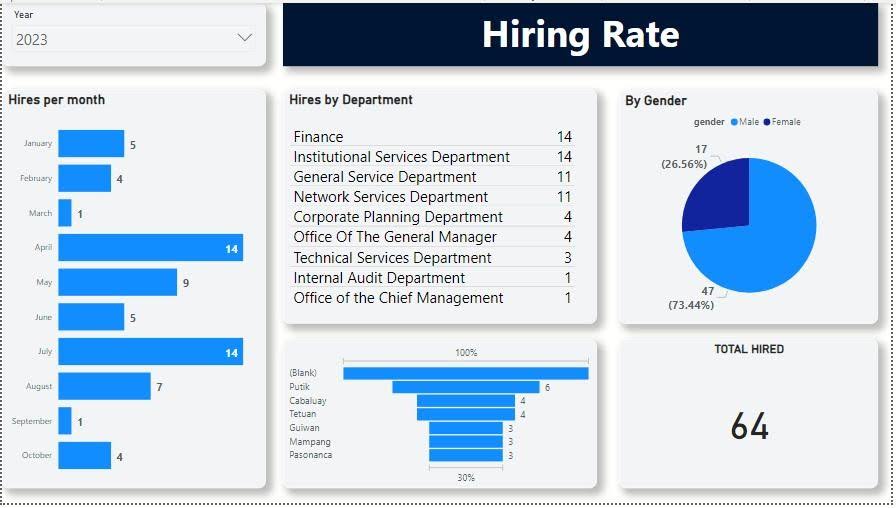
The HR Hiring Rate Dashboard in Power BI is a strategic tool for monitoring recruitment performance. It features bar charts displaying hires per month, along with breakdowns of total hires by department and gender. The dashboard also provides the overall total number of hires, offering a comprehensive view of hiring trends and demographics. This helps HR professionals to analyze recruitment effectiveness and make data-driven decisions to improve hiring processes.

Payroll System

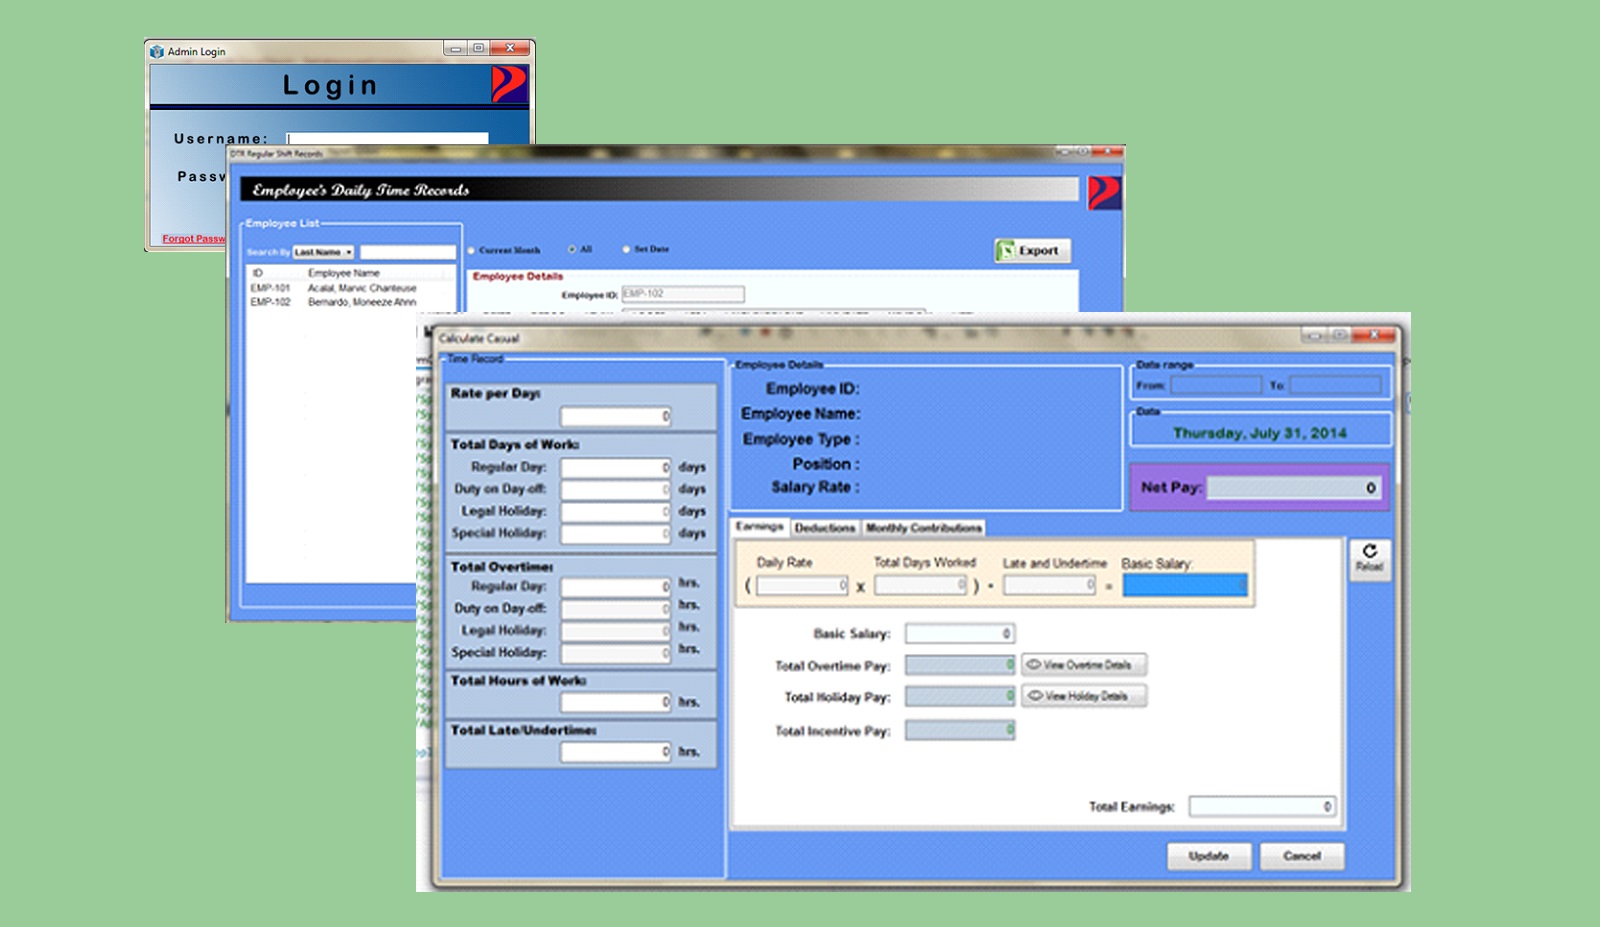
This Payroll System is designed and developed using C# .NET to efficiently handle all salary related record of employees in Petroline Marketing.

Collection System

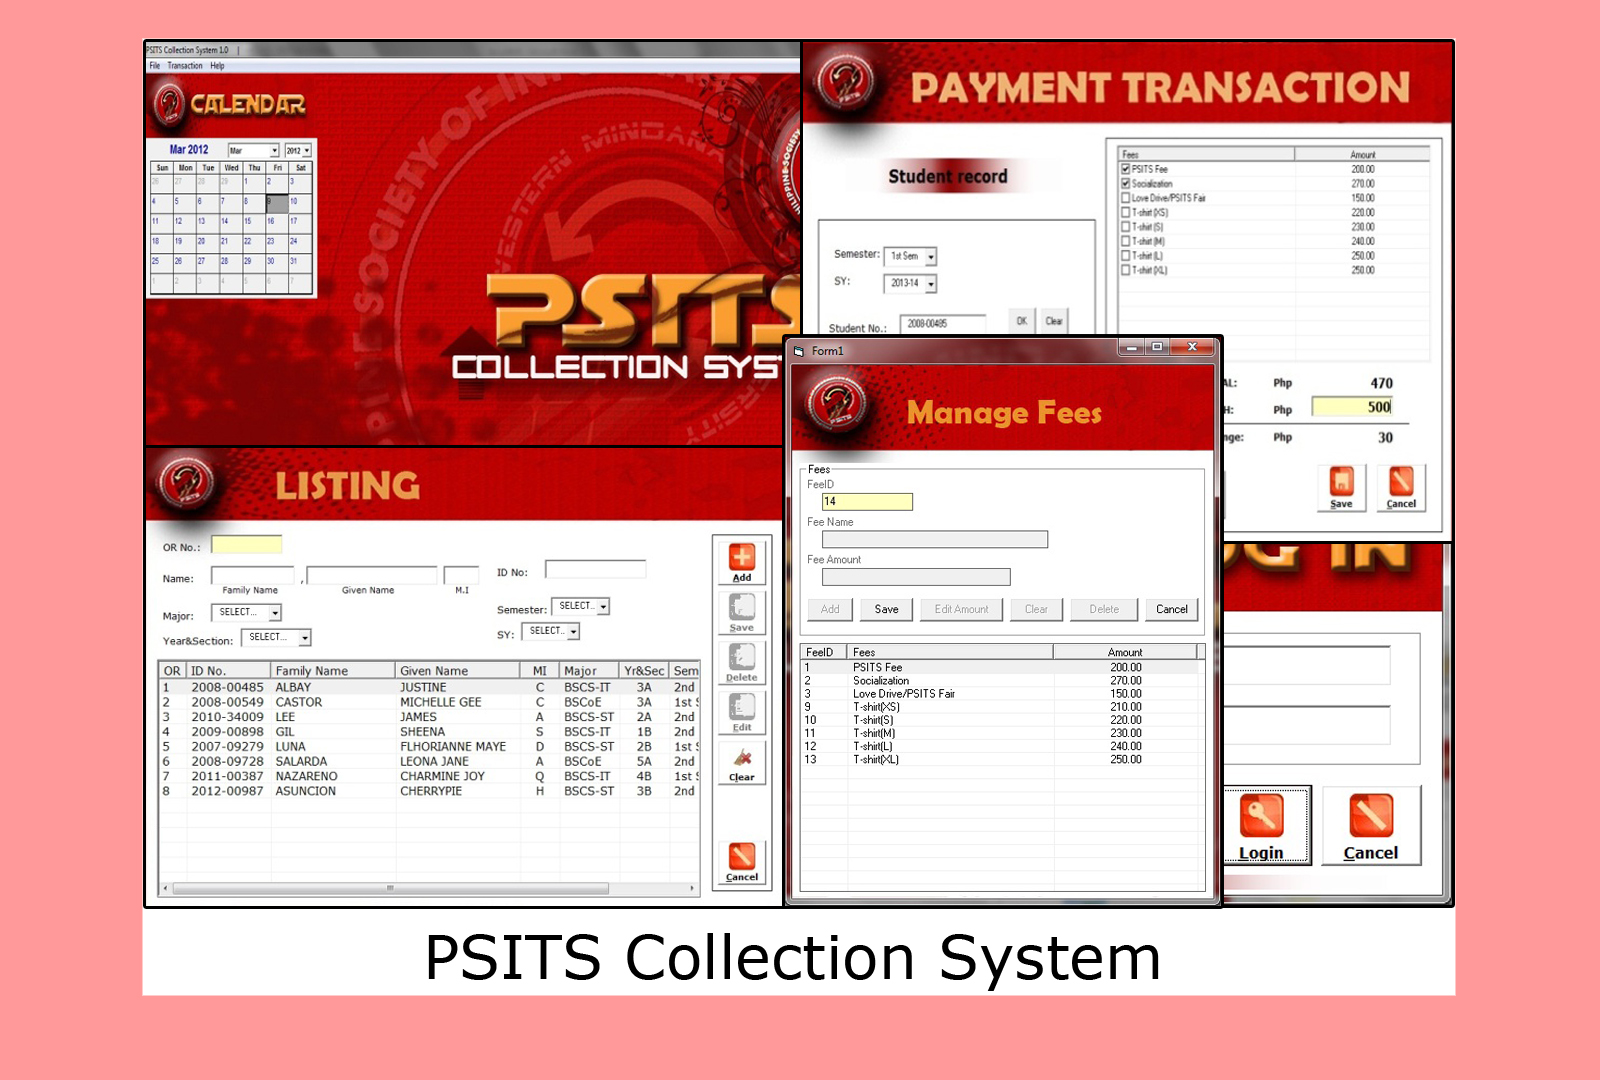
This Collection System is designed and developed using Visual Basic 6. To manage collections in PSITS(Philippine Society of IT Students) Office.

Adobe Flash Game

The proposed game is a simple math game with questions of simple math problems and equations. ActionScript 3.0